Ordinal predictions: Bayesian Network

Assessing the calibration of a Bayesian network predicting the number of pregnancies in an IVF treatment.

Author

Teemu Säilynoja

Published

February 1, 2023

Modified

June 14, 2023

imports
library(cmdstanr)
library(DirichletReg)
library(bayesplot)
library(ggplot2)
library(reliabilitydiag)
library(khroma)

# Source for the modified reliability plot
source("../../code/helpers.R")

theme_set(good_theme)
bayesplot_theme_set(good_theme)
color_scheme_set(scheme = c(unname(colour("vibrant")(7)[c(3,2,5,4,1,6)])))

scale_colour_discrete = scale_colour_vibrant
scale_fill_discrete = scale_fill_vibrant

SEED <- 236543
set.seed(SEED)
SAVE_FITS = TRUE
SIM_IIRM = TRUE # whether to use the inferred parameter values from the paper.

Below we inspect the calibration of a Bayesian network model, introduced by Corani et al. and aimed at predicting the number of pregnancies resulting from an IVF treatment.

Data generation

Code
standata <- list()
standata$P = 0
while(max(standata$P) < 3) {
  pA = c(rdirichlet(1, rep(3, 3)))
  if (SIM_IIRM == TRUE) {
    pU = c(.78, .58, .26) # IIRM value from paper
  } else {
    pU = sort(runif(3), decreasing = T)
  }
  pS = c(rdirichlet(1, rep(3 , 4)))
  if (SIM_IIRM == TRUE) {
    pE = c(0, .07, .21, .39)# IIRM value from paper
  } else {
    pE = c(0, sort(runif(3)))
  }
  N <- 388
  standata$N = N
  standata$A = sample(1:3, size = N, replace = T, prob = pA)
  standata$S = t(replicate(n = N, sample(1:4, size = 3, replace = T, prob = pS)))
  standata$P = sapply(1:N, function(n) rbinom(1,1, pU[standata$A[n]]) * sum(rbinom(3,1, pE[standata$S[n, ]])))
}

Bayesian network model

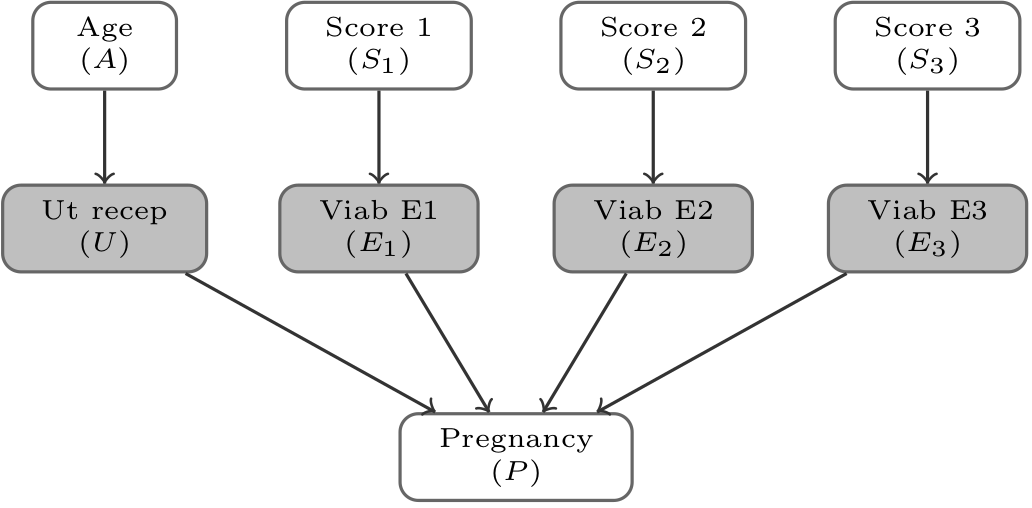
Stan implementation of the BN model introduced in the paper. In short, the number of pregnancies is modeled to be equal to the number of viable embryos, \(e\), provided the uterus is receptive during the transfer, \(u\).

The observed variables are the patient age, \(A\) split to 3 age categories, and the quality of the transferred embryo, \(S \in \{1,\dots,4\}\), where \(1\) means no transfer and categories \(2\) to \(4\) are in a ascending order based on quality.

\[ P = \mathbb I(U = u)\sum_{i=1}^3\mathbb I(E_i = e), \]

Network graph.

As the likelihood computation is rather involved, here I just refer to the article and move to the Stan implementation.

Code
model <- cmdstan_model(stan_file = "../../code/stan-models/bn_classifier.stan")
model
data {
  int N;
  array[N] int A;
  array[N, 3] int S;
  array[N] int P;
}

parameters {
  simplex[3] pA;
  simplex[4] pS;
  vector<lower=0, upper = 1>[3] pU;
  vector<lower=0, upper = 1>[3] pE_;
}

transformed parameters {
  vector<lower=0, upper = 1>[4] pE;
  pE[1] = 0;
  pE[2:4] = pE_;
}

model {
  // Priors
  pA ~ dirichlet(rep_vector(1.0/3, 3));
  pS ~ dirichlet(rep_vector(.25, 4));
  pU ~ beta(1,1);
  pE_ ~ beta(1,1);

  // Likelihood
  for (n in 1:N) {
    target += categorical_lpmf(A[n] | pA);
    target += categorical_lpmf(S[n,] | pS);
  }

  for (n in 1:N) {
    if (P[n] > 0) {
      target += log(pU[A[n]]);
      if (P[n] == 1) {
        target += log(
          pE[S[n,1]] * (1 - pE[S[n,2]]) * (1 - pE[S[n,3]]) +
          (1 - pE[S[n,1]]) * pE[S[n,2]] * (1 - pE[S[n,3]]) +
          (1 - pE[S[n,1]]) * (1 - pE[S[n,2]]) * pE[S[n,3]]
        );
      }
      if (P[n] == 2) {
        target += log(
          pE[S[n,1]] * pE[S[n,2]] * (1 - pE[S[n,3]]) +
          (1 - pE[S[n,1]]) * pE[S[n,2]] * pE[S[n,3]] +
          pE[S[n,1]] * (1 - pE[S[n,2]]) * pE[S[n,3]]
        );
      }
      if (P[n] == 3) {
        target += log(pE[S[n,1]] * pE[S[n,2]] * pE[S[n,3]]);
      }
    } else {
      target += log(
        1 - pU[A[n]] * (
          pE[S[n,1]] * (1 - pE[S[n,2]]) * (1 - pE[S[n,3]]) +
          (1 - pE[S[n,1]]) * pE[S[n,2]] * (1 - pE[S[n,3]]) +
          (1 - pE[S[n,1]]) * (1 - pE[S[n,2]]) * pE[S[n,3]] +
          pE[S[n,1]] * pE[S[n,2]] * (1 - pE[S[n,3]]) +
          (1 - pE[S[n,1]]) * pE[S[n,2]] * pE[S[n,3]] +
          pE[S[n,1]] * (1 - pE[S[n,2]]) * pE[S[n,3]] +
          pE[S[n,1]] * pE[S[n,2]] * pE[S[n,3]]
        )
      );
    }
  }
}

generated quantities {
  array[N] vector[4] ppm;
  vector[N] yrep;

  for (n in 1:N) {
    ppm[n, 1] = 1 - pU[A[n]] * (
          pE[S[n,1]] * (1 - pE[S[n,2]]) * (1 - pE[S[n,3]]) +
          (1 - pE[S[n,1]]) * pE[S[n,2]] * (1 - pE[S[n,3]]) +
          (1 - pE[S[n,1]]) * (1 - pE[S[n,2]]) * pE[S[n,3]] +
          pE[S[n,1]] * pE[S[n,2]] * (1 - pE[S[n,3]]) +
          (1 - pE[S[n,1]]) * pE[S[n,2]] * pE[S[n,3]] +
          pE[S[n,1]] * (1 - pE[S[n,2]]) * pE[S[n,3]] +
          pE[S[n,1]] * pE[S[n,2]] * pE[S[n,3]]
        );
    ppm[n, 2] = pU[A[n]] * (
      pE[S[n,1]] * (1 - pE[S[n,2]]) * (1 - pE[S[n,3]]) +
      (1 - pE[S[n,1]]) * pE[S[n,2]] * (1 - pE[S[n,3]]) +
      (1 - pE[S[n,1]]) * (1 - pE[S[n,2]]) * pE[S[n,3]]
      );
    ppm[n, 3] = pU[A[n]] * (
      pE[S[n,1]] * pE[S[n,2]] * (1 - pE[S[n,3]]) +
          (1 - pE[S[n,1]]) * pE[S[n,2]] * pE[S[n,3]] +
          pE[S[n,1]] * (1 - pE[S[n,2]]) * pE[S[n,3]]
    );
    ppm[n, 4] = pU[A[n]] * (pE[S[n,1]] * pE[S[n,2]] * pE[S[n,3]]);

    yrep[n] = categorical_rng(ppm[n, ]);
  }
}
Although issues with multimodality were suggested by the original authors, the model samples very quickly with no apparent issues during the sampling process.

Code
fit <- model$sample(data = standata,
                    parallel_chains = 4,
                    refresh = 0,
                    seed = SEED)
Running MCMC with 4 parallel chains...

Chain 3 finished in 15.6 seconds.
Chain 1 finished in 15.7 seconds.
Chain 2 finished in 16.3 seconds.
Chain 4 finished in 16.2 seconds.

All 4 chains finished successfully.
Mean chain execution time: 16.0 seconds.
Total execution time: 16.4 seconds.
Code
# Compute the posterior means of the predictive probability mass of each case
ppm <- matrix(colMeans(fit$draws(variables = "ppm", format = "matrix")), ncol = 4)

Posterior predictive checks

A crude visualization of the posterior frequency of each case with 90% posterior predictive intervals suggest no discrepancies between the observed frequencies and the posterior expectations.

Code
ppc_bars(y = standata$P,
         yrep = fit$draws(variables = "yrep", format = "matrix") - 1,
         prob = .9,
         freq = F)

The reliability diagrams also show no reason to worry in terms of model calibration.

Code
plot_dotted_reliabilitydiag(x = pmin(1, rowSums(ppm[,-1])),
                y = as.numeric(standata$P != 0), quantiles = 50) +
  labs(title = "Calibration: P >= 1")

Code
plot_dotted_reliabilitydiag(x = pmin(1, rowSums(ppm[,-c(1,2)])),
                y = as.numeric(standata$P > 1), quantiles = 50) +
  labs(title = "Calibration: P >= 2")

Code
plot_dotted_reliabilitydiag(x = pmin(1, ppm[,c(4)]), y = as.numeric(standata$P == 3), quantiles = 20) +
  labs(title = "Calibration: P = 3")

Marginal posteriors

Most of the parameter values were recovered well with the reported values falling within the 50% posterior central interval.

Parameters of interest

Code
color_scheme_set(scheme = color("BuRd")(13)[6:1])
mcmc_areas(fit$draws(variables = "pU", format = "matrix")) + vline_at(v = pU, colour = "#666666")

Code
mcmc_areas(fit$draws(variables = "pE", format = "matrix")[,-1]) + vline_at(v = pE[-1], colour = "#666666")

Population parameters

For some reason, the authors also model the frequencies of the different observation categories in the population. These are also recovered quite well.

Code
mcmc_areas(fit$draws(variables = "pA", format = "matrix")) + vline_at(v = pA, colour = "#666666")

Code
mcmc_areas(fit$draws(variables = "pS", format = "matrix")) + vline_at(v = pS, colour = "#666666")